Plot §
Notes and Ideas: §
- Histogram
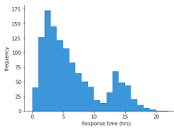
- Frequency distribution
- on the y is either frequency of proportion
- x would be a column of the data
- x would be the input to the histogram
- only take on column and taking the distribution of the column
- note:
- only use it for numerical data
- distribution of one numerical column
- Bar Plot
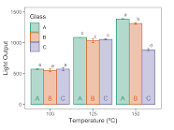
- input x - > categorical column
- input y-> summarized numerical statistic aggregated by x
- Pi Chart
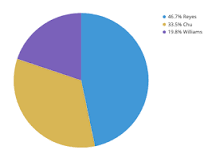
- Take the numerical data that represent the categorical value
- x: categorical column
- y: numerical measure for each slice
- good for limited categorical choice
- Heat map
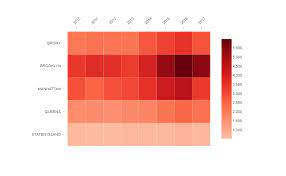
- matrix like plot
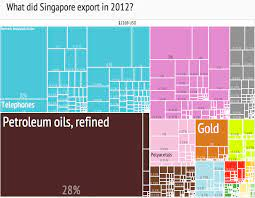
- Tree map
- scatter plot
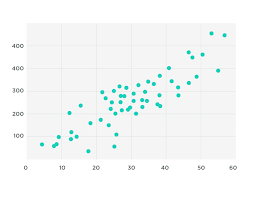
- x and y
- each dot is the pair location of (x,y), 2 input
- both X and Y need to be numerical
- Line plot
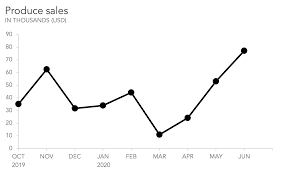
- both need to be numerical
- it show the trend of the x and y changes
- Boxplit:
- 1 input: X numerical
- summary data
Key words: §