Optimizing User Browsing Experience on Netflix: An Experimental Approach
Authors:
- John Bailey
- Vineeth Guptha Bodla
- Freeman Chen
- Daniel Gonzalez
Abstract
In the rapidly evolving landscape of online streaming, user experience optimization is essential for increasing user engagement and satisfaction. Employing a factorial design, we manipulated four key factors: Tile Size, Match Score, Preview Length, and Preview Type, in order to investigate the impact of these elements on the Netflix homepage on user browsing time. A multivariate analysis was performed utilizing response surface methodology which found preview type Trailer/Teaser (vs. Actual Content), tile size 0.2, match score 70%, and preview length of 77 seconds were associated with the greatest reduction in browsing time (μ=10.022 minutes, 95% CI 9.834 - 10.210). The additional finding of a strong interaction effect between match score and preview length suggests that optimization of these two factors are the most important in increasing platform efficiency and user satisfaction.
Introduction
Netflix, originally founded in 1997 as a DVD rental service, has now emerged as a dominant force in the entertainment industry due to its original content and a data-driven culture emphasizing online experimentation. An inherent challenge in such a vast content library is the phenomenon of decision paralysis among users, leading to extended browsing times. This study focuses on optimizing the graphical features of the Netflix homepage to reduce browsing time, thereby enhancing user satisfaction and engagement.
Netflix’s homepage is designed to streamline
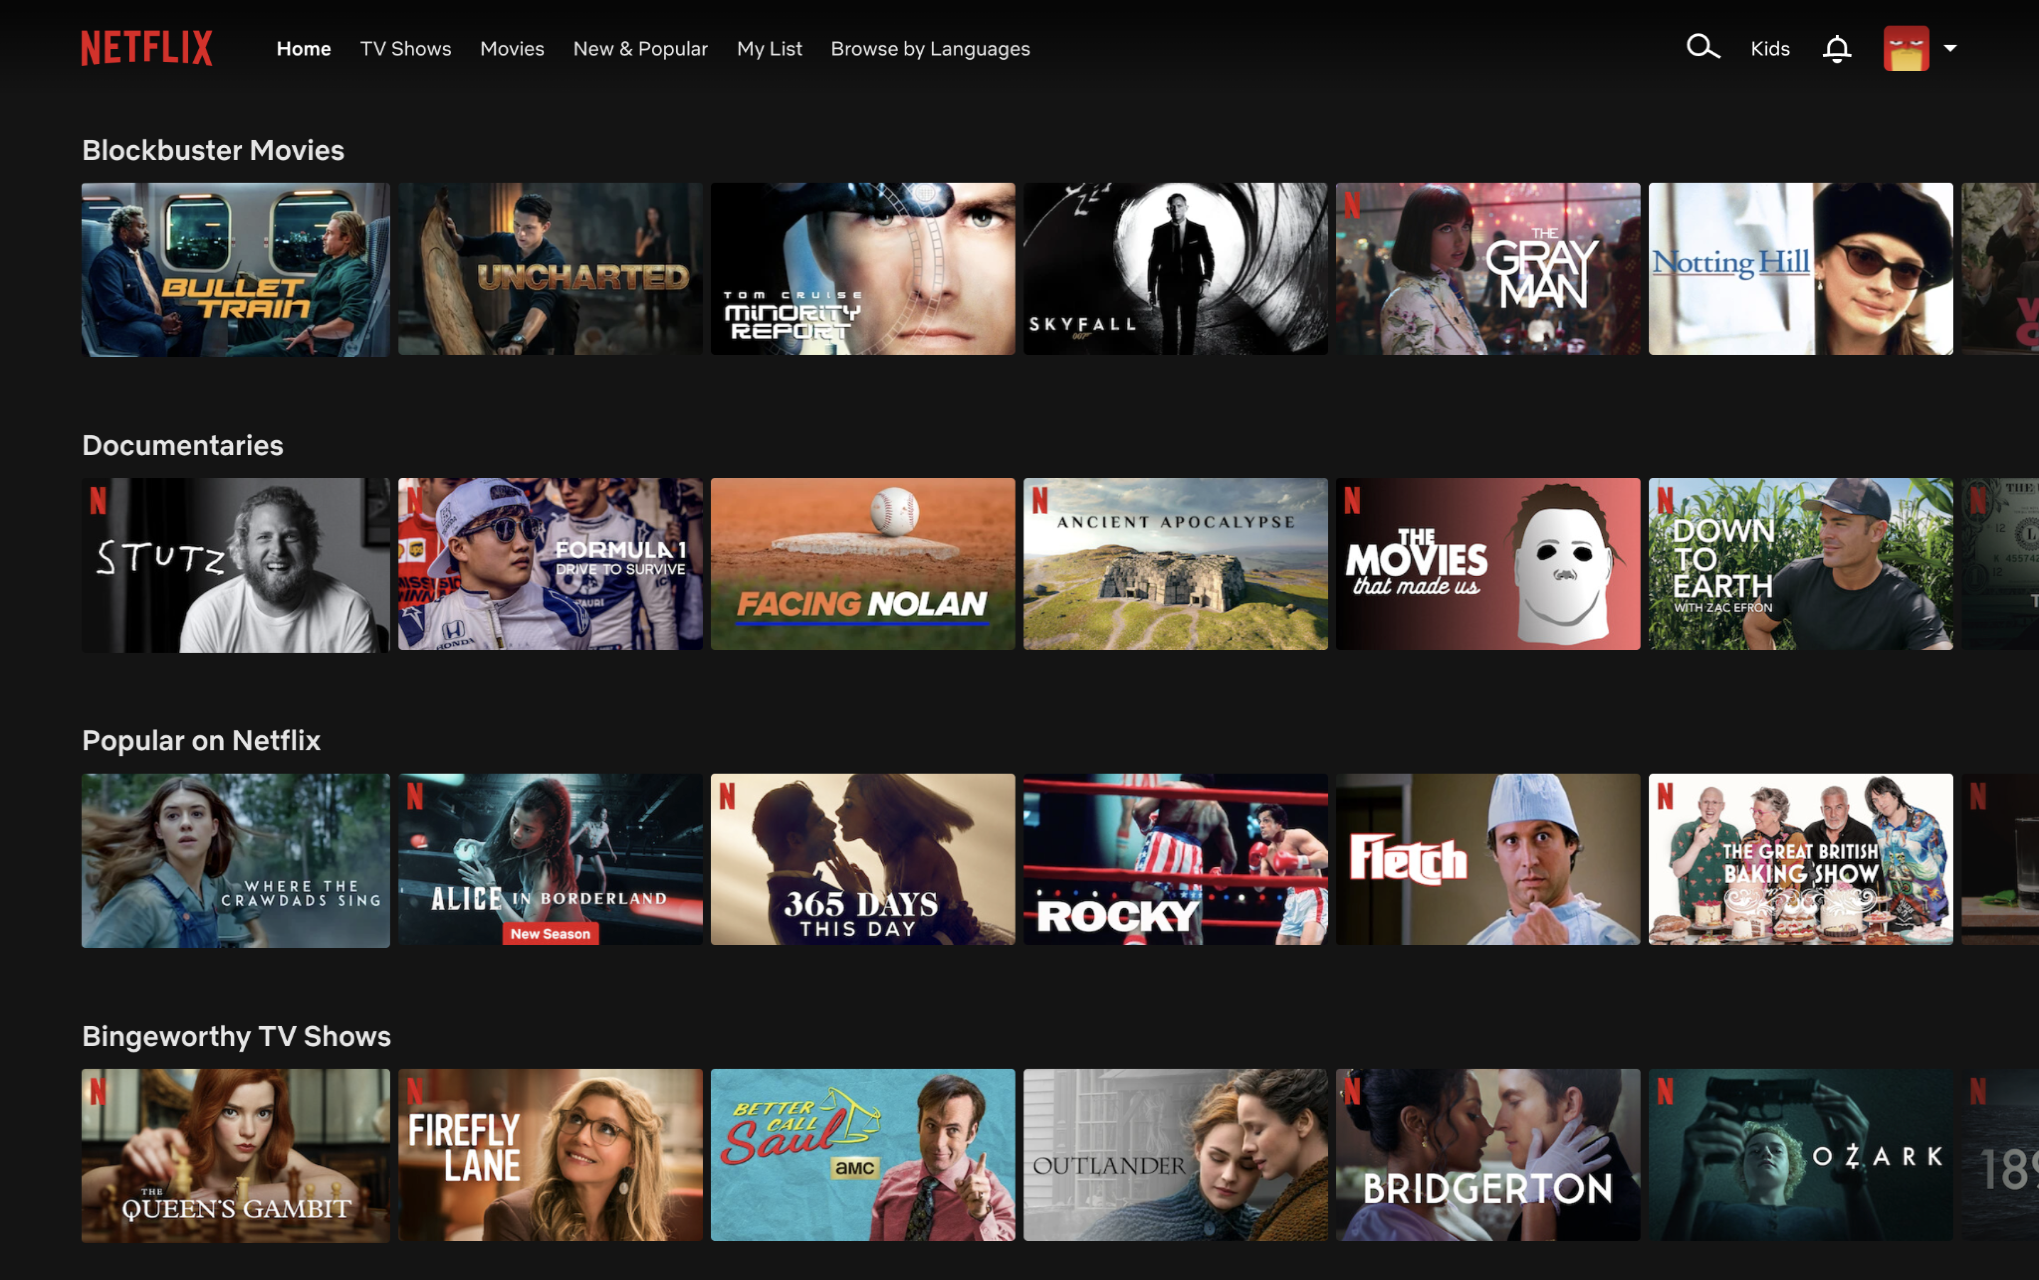
content discovery and selection. As shown in Figure 1, the homepage consists of a grid layout, with movies and TV shows presented as tiles. The tiles vary in size and are categorized into rows, personalized to the user’s viewing history. A notable feature, not depicted, is the interactive nature of these tiles: hovering over a tile enlarges it and triggers an autoplay preview of the content or a trailer/teaser for the content. This design is central to the user’s browsing experience, as it influences the efficiency with which users make viewing decisions.
Our study focuses on optimizing four key factors of this layout in order to reduce decision paralysis faced by the user, which will be measured by time spent browsing the homepage. We hypothesize that default tile size of 0.2, high match score (>80%), short preview length (<60s), and TT preview type will contribute to the greatest reduction in time spent on the homepage, with match score and preview length having the greatest effect.
Figure 1 - Netflix homepage
Methods
We adopted a factorial experimental design allowing for the exploration of main effects and interactions among the four chosen variables on user browsing time (Table 1). Eight rounds of testing were sequentially, with both univariate and multivariate performed in between rounds in order to identify optimal testing parameters for subsequent rounds. Using a web-based simulator, each experimental condition was tested on n=100 users and browsing time for each user and configuration was recorded in minutes. The data were analyzed using forward response surface methodology modeling optimization in order to determine the impact of each factor and factor interactions on browsing time.
Results
The first round of testing (8 conditions) was Figure 2 - Univariate effect of preview type
 performed with the tile size held constant at the default value (0.2) with all combinations of the following parameters: match score {60,90}, preview length {60,90}, preview type {TT, AC}. It was found that there was a 5 min reduction in browsing time for the trailer/teaser (TT) preview type (μ=14 min) compared to the actual content preview type (μ=19 min), visualized in figure 2. A two-sample t-test to compare the average browse time between preview types TT and AC resulted in t-statistic of -41.46 and p < 0.001, which provided Figure 3 - Estimated Response Surface
strong evidence to conclude that TT is associated with a significantly reduced browsing time. Due to the magnitude of this effect, TT was set as the final condition for the preview type, and no further investigations on the AC preview type were performed.
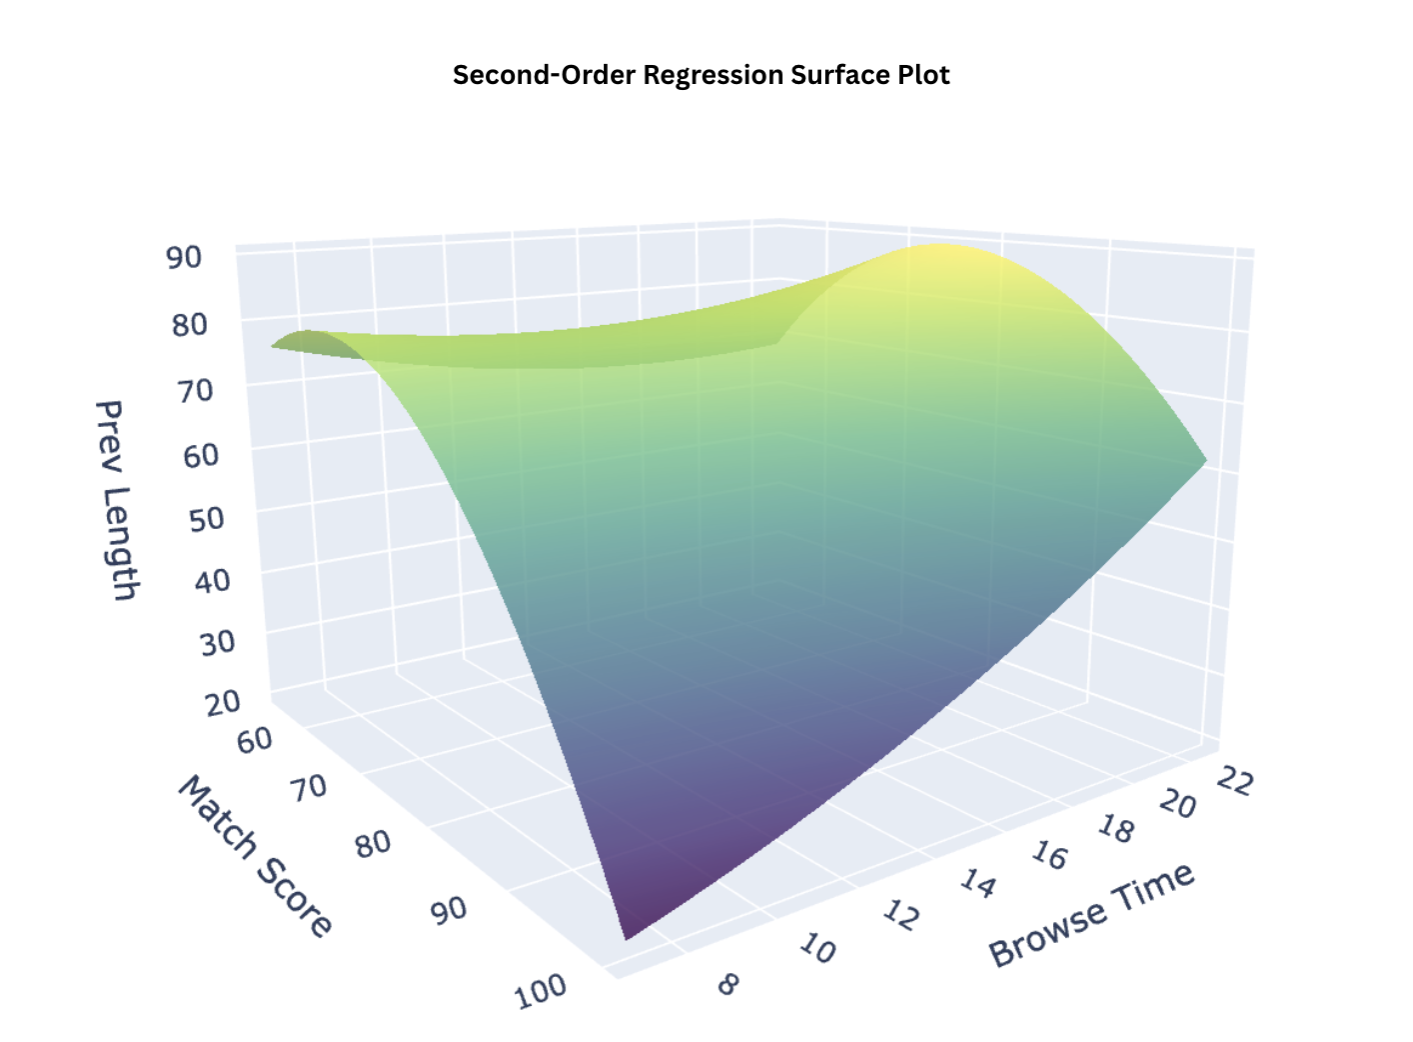
Six additional rounds of testing (k = 4, 7, 4, 4, 5, 4, respectively) were then performed on various combinations of match score (range 55-100%) and preview length (range 30s-90s) with tile size (0.2) and preview type (TT) held constant. First and second order response surfaces were calculated in between each round to identify surface minima associated with optimal feature values, ultimately yielding an optimal match score of 70% and preview length of 77 seconds associated with an average browsing time of just over 10 minutes (μ=10.022 minutes, 95% CI 9.834 - 10.210). The response surface estimated from this data is visualized in Figure 3.
The eighth and final round of testing (k = 4), investigated the effect of tile size (range 0.1-0.5) on the estimated model. This test found no significant decrease in browsing time associated with tile sizes other than the default ratio of 0.2, both validating our hypothesis that tile size would not have a significant effect on browsing time, as well as our final model for optimal browsing time: Tile Size 0.02, Match Score 70%, Preview Length 77 seconds, and Preview Type TT.
A significant interaction between match score Figure 4 - Feature Interaction
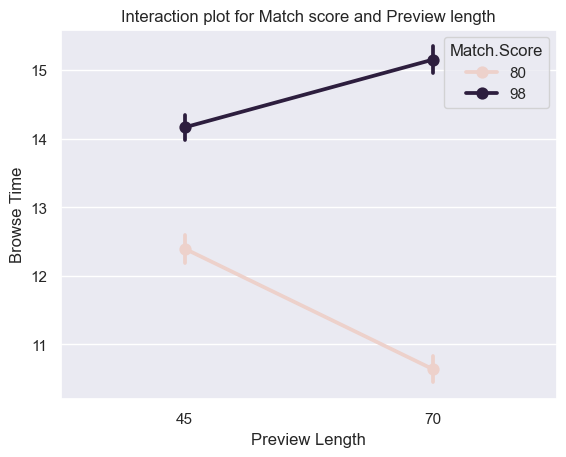 and preview length was also discovered during testing. As seen in Figure 4, a match score of 80 shows a 2 minute decrease in browse time (12.5-10.5 min) as the preview length increases from 45s to 70s, suggesting that for lower match scores, longer previews lead to shorter browse times. However, for a match score of 98, as the preview length increases from about 45s to 70s, the browse time increases by 1 minute (14.2-15.2 min), suggesting that for higher match scores, longer previews lead to longer browse times.
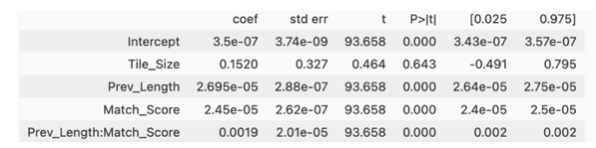
To further validate our final model, a subsample (n=500) of the full data was selected for regression analysis with varying tile sizes (0.1-0.5) and all other parameters kept constant at their optimal values (match score 70%, preview length 77s, preview type TT). An OLS regression (Table 2), showed all features, including the interaction of match score and preview length, were significant predictors of browse time (all p < 0.001), except tile size (p = 0.643), at a 95% confidence level. This result further supports the previous conclusion that tile size does not wield a statistically significant impact on browse time, and should remain set to the default ratio of 0.2.
Discussion
There are a few limitations of this study that must be addressed in order to provide a complete picture of the results obtained herein. The first is a practical limitation on preview length. Since the preview length needs to be a factor of 5 we would assume that rounding the preview time down from 77 to 75 seconds would produce optimal results. However, it may be beneficial to test both 75 and 80 seconds depending on the degree of estimate accuracy required. Furthermore, limiting preview length to a (non-optimal) factor of five might cause a shift in the optimal value of other variables, especially match score, due to the strong interaction between the two features.
Similarly, even though our analysis showed that a 70% match score and 77 second long preview were the optimal values to mitigate browse time, customer satisfaction might provide a practical barrier to implementation considering that 70% match is a somewhat low score. As noted in the experiments above, the significant inverse relationship between match score and preview length provides a built-in mitigation against real-world practical issues. In practice, it may be found that it is preferable to suffer a slight increase in browse time in order to offer users a significant increase in content with high match score (>90%), for the purpose of customer satisfaction and retention.
Additionally, our initial test for preview type proved that there is a significant statistical difference between teaser trailers (TT) and actual content (AC) with the teaser trailers resulting in a nearly 5 minute shorter mean browse time than actual content. Due to the strength of this result, this feature was not further investigated. Therefore, it is not possible to know if there are extant strong, localized effects or interactions for preview type AC, which might result in significantly improved browse time compared to the condition presented in this study. Because of this decision, the effects of preview type AC are of significant interest in future research on this topic.
Finally, our choice of tile size of 0.2 comes from the OLS regression which suggested its statistical insignificance to the overall browse time. Since it was not included in the RSM search, it is not possible to know for sure if it is truly the optimal value due to lack of interaction effect data. The slightly lower mean browse time for 0.2 compared to the other choices is likely due in some part to randomness. As with the preview type variable, more conditions and rigorous testing should be performed to increase confidence in the model we present in this study.
Conclusion
Our research has successfully determined the ideal settings to enhance user engagement: a tile size of 0.2, a match score threshold of 70%, and a preview length adjusted to 75 seconds for practical implementation, closely reflecting our optimal finding of 77 seconds. This configuration has proven effective, significantly reducing the average browsing time to 10.022 seconds compared to the standard metrics. Our hypotheses that TT preview type and 0.2 tile size would be associated with optimal browse time were correct, while our hypotheses concerning match score (originally >80%) and preview length (<60s) were not accurate.
Lastly, our study comes with certain constraints that must be acknowledged, especially concerning the validity of the conclusions surrounding TT preview type and 0.2 tile size as the optimal values. The limited scope of conducted tests and the unpredictable nature of user behavior are factors that could affect the generalizability of our results. Despite the robust improvements seen, these limitations underscore the importance of continued research to validate and refine our recommendations, ensuring they remain effective across broad user scenarios.