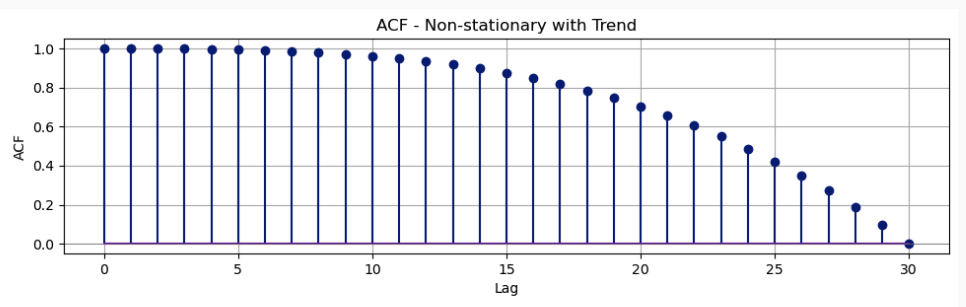
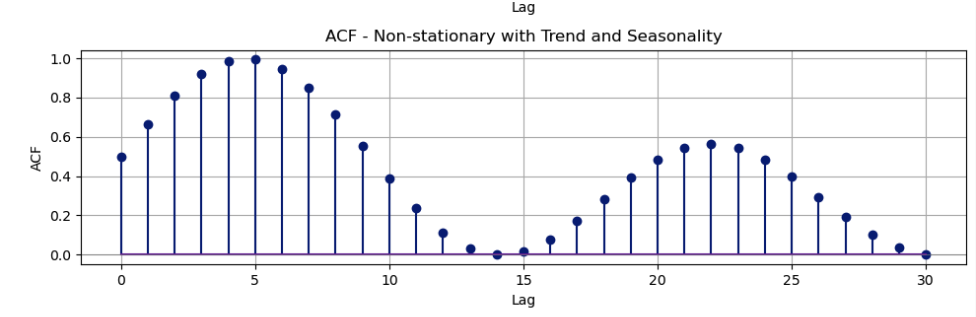
ACF and PACF plots
ACF plots
Partial Autocorrelation Function (PACF)
-
PACF is a component of the Autocorrelation Function (ACF).
-
The Partial Autocorrelation
at lag is given by: { are fixed}) This measures the direct correlation between
and when the intervening lags are controlled for.
Idea
-
Consider indirect correlation through intervening periods as demonstrated in the following example:
January
→ Food Festival February March → Food Festival There is direct correlation between the Food Festivals of January and March.
Estimating PACF
- To estimate
at lag , consider:
Where
Interpretation of PACF
PACF Plots
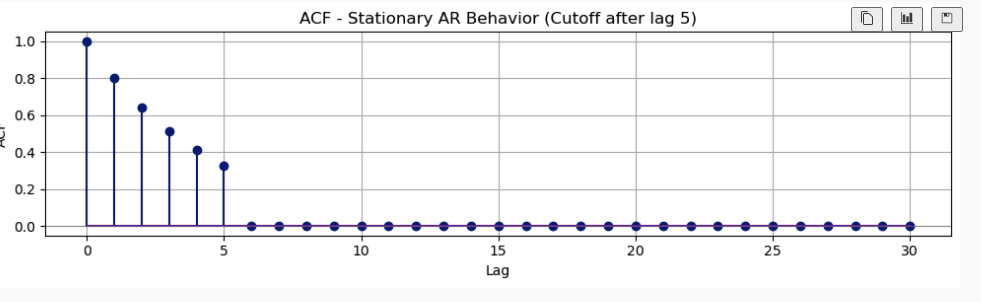
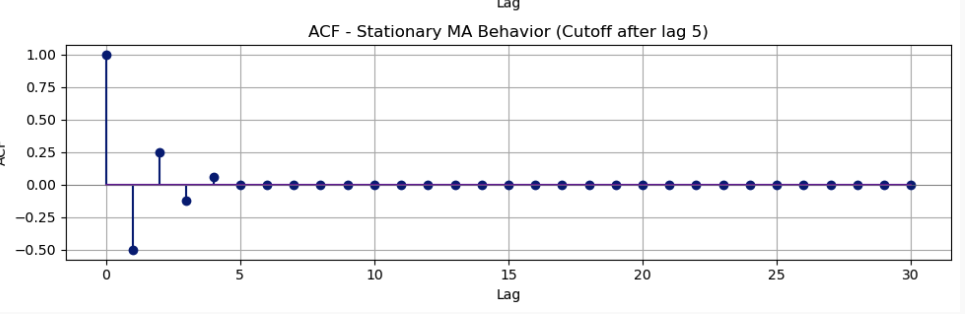
- AR(p) shows cutoff behavior after lag
. - MA(q) shows tapering off or damping behavior.
- ARMA(p,q) may show a mix of these behaviors.
Model Selection Criteria
AIC and BIC
Choose the model with the smallest AIC/BIC value.
Note: Fit the model with all the data to calculate AIC/BIC. No train-test method should be combined here.